With the Fingerprint Data module, BIONUMERICS offers the most comprehensive tools for the processing of 1-D electrophoresis patterns:
- Import any bitmap images (8, 12, and 16 bit), densitograms and chromatograms.
- Reading graphical and desitometric file formats from image files.
- Automated lane finding.
- Alignment of patterns through normalization.
- Band finding and quantification
- Band matching
- ... and much more.
What are fingerprints?
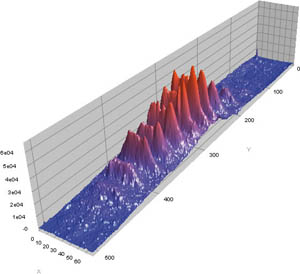
A fingerprint is defined as any densitometric record seen as a profile of peaks or bands. Examples are electrophoresis patterns (gel, capillary), gas chromatography or HPLC profiles, spectrophotometric curves, MALDI, SELDI, etc.
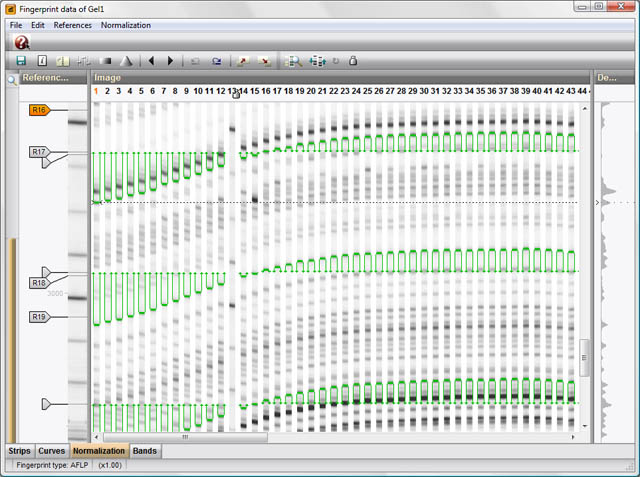
 Since electrophoresis is an important technique in studying relationships in biology, BIONUMERICS offers comprehensive tools for preprocessing electrophoresis fingerprints. These tools include reading graphical and densitometric file formats from image files and automated sequencers, lane finding, normalization (alignment of patterns), band finding and quantification, band matching, etc.
In addition to the wide range of analysis functions for fingerprint data, BIONUMERICS provides comprehensive tools for automated preprocessing and analysis of specific fingerprint types such as MALDI, dHPLC, and electropherograms from automated sequencers. The software also offers a number of specialist plugins for electrophoresis-based applications such as VNTR or MLVA, spa-typing, AFLP-based breeding, etc. Through its easy and powerful script language, BIONUMERICS can import and process virtually any type of fingerprint data from any manufacturer.
Band matching analysis
Multiple alignments of patterns can be obtained by conducting a global band matching, a process that subdivides all bands from a set of patterns into band classes. Band matching has the advantage that data matrices can be generated containing the band classes as characters, which can be applied in a number of phylogenetic and statistical techniques that require a character table as input. Global band matching is calculated in the Comparison window from any selection of patterns.
Capillary sequencer fingerprint processing
BIONUMERICS features a powerful tool for processing capillary sequencer fingerprints, i.e. electropherograms obtained from fragment analysis on multichannel capillary electrophoresis (CE) equipment.
The processing of a full capillary electrophoresis run can now be completed in seconds, rather than in minutes and consists of the following three steps:
Gel image processing and normalization
MALDI-TOF analysis
Peak quantification
Band-search algorithms with adjustable sensitivity for shoulder and double-band finding. Possibility to find and mark uncertain bands/peaks. Quantification of molecular sizes or any other metric unit using linear, logarithmic, combined logarithmic-third power regression, cubic spline or pole functions. Accurate expression of protein or nucleic acid quantities or concentrations based on cubic spline regression using known calibration peaks. Comparative quantification of bands/peaks between groups of patterns.